
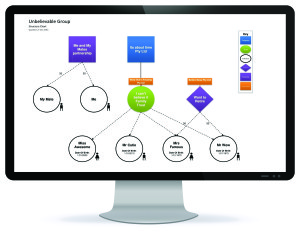
Following the launch of our structure chart software VizulateTM at the 2015 Australian Technology Showcase Australia (ATSA), we’re even more confident that this product has the potential to assist people in a big way.
From the discussions we had with a range of accountants across Australia and New Zealand, it’s evident that when it comes to doing structure charts – it’s a pain!
Most comments we were hearing from attendees were:
- They are taking a long time to do (anywhere from 30 minutes up to 3 hours)
- No consistency within their firms (some using word, powerpoint or other software)
- Some clients have a structure chart and some do not – they usually didn’t have one as it was too hard to do or would take too long
- Difficulty of explaining a client’s structure to the client, new graduates or fellow team members and external advisers (lawyers, bank managers, financial planners etc.)
That’s really why we created VizulateTM – to make light work of charting in an accountant friendly way, simplify what can often be confusing and complex, and deliver powerful diagrams to help clients understand what matters.
The best way to see how VizulateTM can help you design and create structure charts with ease is to access the free 14 day trial and try it for yourself – like many of the attendees who came and spoke to our team at ATSA have already done!