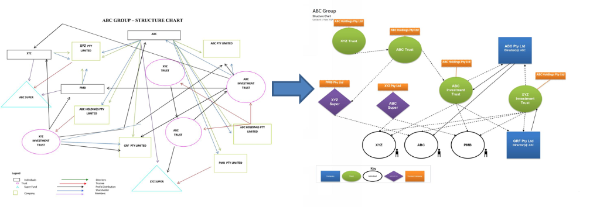
This is a real life example from an accounting practice of how VizulateTM is transforming structure charts. In just a few clicks, we transformed this complex, confusing, and unclear diagram into a powerful and simple chart that not only the client can understand – but even those on the job!
So whether you’re chewing time fiddling with shapes and lines, or everyone in your team is doing something different – Click Here to try Vizulate for free, and see what your transformation might look like!

